Top 10 Data-Driven KPIs Every Hospital Administrator Should Track

In India’s fast-changing healthcare market, hospital leaders must rely on data-driven hospital KPIs to manage capacity, clinical quality, finances and compliance. This listicle explains the top 10 KPIs, how to measure them, India-relevant benchmarks and practical steps administrators can take today. Where appropriate, we cite national standards and peer-reviewed guidance so you can act with confidence. [1][2][3]
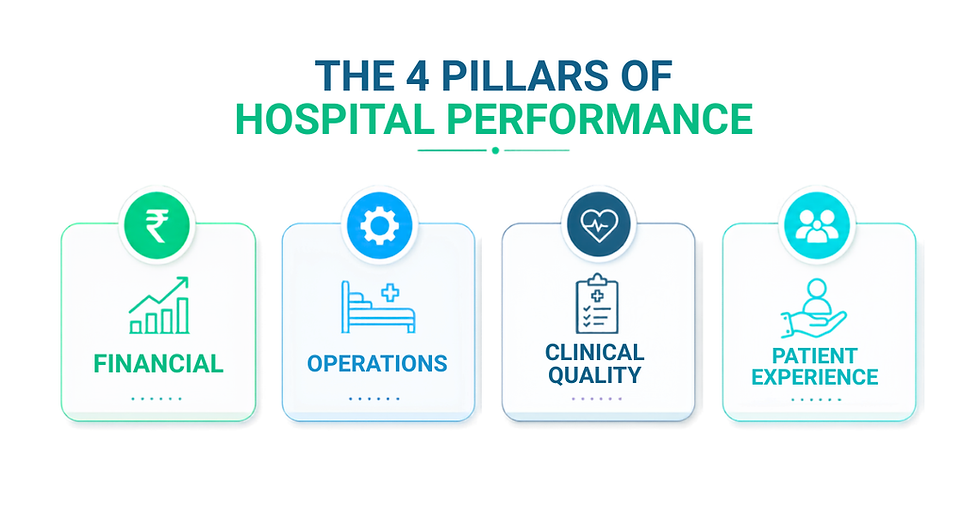
1. Revenue Growth Rate (Financial)
What it measures: Percentage change in revenue over a period.
Formula: (Current period revenue − Previous period revenue) / Previous period revenue × 100.
India benchmark: India's hospital market was valued at US$98.98 billion in 2023 and is projected to grow at a CAGR of 8.0% through 2032, reaching an estimated US$193.59 billion. Individual hospitals adapting new services or expanding payer empanelment can reasonably benchmark growth against this sector-wide trajectory. [5]
Why it matters: Tracks market traction, impact of empanelment under schemes such as AB-PM-JAY (which received a Rs. 9,500 crore / US$1.08 billion allocation in the FY27 Union Budget) and return on new services like telemedicine. [4]
How to track: Monthly finance reports from your HIS/ERP; visualise trends in dashboards and segment by payer (PM-JAY, private insurance, OOP).
Action: If growth stalls, audit payer mix and utilisation of empanelment or new OPD services.
2. Expense-to-Revenue Ratio (Financial)
What it measures: Operating cost efficiency.
Formula: Total expenses / Total revenue × 100.
India benchmark: Indian private hospitals' operating profit margins (OPM) to remain strong at 22–23% in FY25 — implying an expense-to-revenue ratio of roughly 77–78% for well-run private players. Public facilities typically run higher, often exceeding 80%, due to staffing and drug costs. [8]
Why it matters: Indicates financial sustainability especially where subsidised care is provided.
How to track: Monthly consolidated P&L and category-level expense dashboards.
Action: Target procurement efficiency, generic drug substitution and process automation to reduce costs.
3. Bed Occupancy Rate (Operational)
What it measures: Percentage of beds occupied over a period.
Formula: (Occupied beds × Days) / (Total beds × Days) × 100.
India benchmark: 70–85% is generally considered optimal for balancing utilisation and care quality; above 90% signals overcrowding. In practice, listed Indian private hospital chains reported average occupancy of 61–63% in FY25, with some operators recovering toward 70–75% through FY26 as new capacity ramped up — indicating that many hospitals still have room to improve utilisation toward the optimal band. [8]
Why it matters: Balances utilisation and quality of care where bed density is low. [6]
How to track: Daily HMIS/EHR bed management feed.
Action: Use occupancy analytics to plan elective admissions, surge staffing and admissions triage protocols.
4. Average Length of Stay (ALOS) (Operational / Clinical)
What it measures: Average inpatient days per discharge.
Formula: Total patient days / Number of discharges.
India benchmark: 4–6 days for general wards in many settings; district hospital averages reported around 5.2 days. [6]
Why it matters: Shortening avoidable stays increases throughput and reduces costs while keeping quality safe. [2][6]
How to track: EHR discharge data and diagnosis-related groups (DRGs).
Action: Implement clinical pathways, faster diagnostics and discharge planning to reduce unnecessary days.
5. Emergency Room Wait Time (Operational)
What it measures: Time from arrival/triage to first clinical contact.
Benchmark: Target <30 minutes per NABH; many high-volume ERs exceed this and need process fixes. [2]
Why it matters: Faster triage reduces mortality risk in acute cases and improves patient experience.
How to track: Timestamped triage and encounter logs in ED information systems.
Action: Streamline triage, add short-stay observation beds and audit peak-hour staffing.
6. Hospital-Acquired Infection (HAI) Rate (Clinical & Quality)
What it measures: Infections per 1,000 patient-days or device-associated infection rates.
Formula example: (Number of HAI events / Total patient-days) × 1,000.
India benchmark: Target <5 per 1,000 patient-days where possible; higher rates are seen in certain settings due to AMR and ICU loads. [2][3]
NABH's 6th edition accreditation standards (effective January 2025) introduced 15 new quality indicators, including department-specific infection metrics such as surgical site infection rate, ventilator-associated pneumonia rate, and CLABSI, giving hospitals more granular benchmarks to track. [7]
Why it matters: Reduces morbidity, length of stay and cost; central to NABH and LaQshya quality programmes. [2]
How to track: Infection-control surveillance, lab-confirmed cases and ICU dashboards.
Action: Strengthen hand-hygiene, environmental cleaning, antimicrobial stewardship and bundle care practices.
7. 30-Day Readmission Rate (Clinical & Quality)
What it measures: Percentage of discharges readmitted within 30 days.
Formula: (Readmissions within 30 days / Total discharges) × 100.
India benchmark: Aim <15% for most settings; chronic conditions often drive higher rates. [3]
Why it matters: High readmissions signal gaps in discharge planning, follow-up and social determinants.
How to track: EHR flags, unique patient IDs and claims data cross-checks.
Action: Post-discharge tele-follow-up, care-coordinator outreach and scheduled early outpatient reviews.
8. Patient Satisfaction Score (Experience)
What it measures: Survey-based average (NPS or 5-point scale).
Benchmark: Target >80% positive feedback for competitive private hospitals; NABH requires periodic analysis. [2]
Why it matters: Drives retention, referrals and patient-centred improvements under PM-JAY empanelment standards. [4]
How to track: Digital surveys (SMS/email), kiosks at exit points and post-discharge calls.
Action: Close feedback loops, train front-line staff on communication and publish monthly improvements.
9. Staff Turnover Rate & Patient-to-Staff Ratio (HR)
What it measures: Turnover = (Departures / Average staff) × 100. Patient-to-staff ratio varies by unit.
Benchmark: Turnover <15% annually desirable; ICU nurse:patient ratios follow IPHS/NABH norms. [2]
Why it matters: High turnover disrupts continuity, increases risk and costs. India faces workforce shortages requiring focused retention strategies. [6]
How to track: HRIS metrics, exit interviews and engagement surveys.
Action: Career pathways, targeted incentives, training and well-being programmes to reduce attrition.
10. Compliance with Accreditation & Regulatory Standards (Quality / Governance)
What it measures: % adherence to NABH, NQAS/NHSRC checkpoints and other statutory norms.
Benchmark: Target >90% compliance for accreditation and incentive eligibility. [2][1]
Why it matters: Accreditation signals quality, unlocks incentives and reduces legal/regulatory risk.
How to track: Internal audits, NABH objective element checklists and NHSRC outcome indicators. [1][2]
Action: Regular mock assessments, document control and closing non-conformities promptly.

Putting the KPIs together: dashboard design and data sources
These KPIs are measurable via HMIS, EHRs, lab systems, finance ERPs and patient feedback tools. NHSRC offers district hospital KPI templates and NHSRC/NABH materials help standardise definitions so comparisons are meaningful. [1][2] Integration into a single dashboard reduces siloed decision-making and highlights trade-offs: e.g., reducing ALOS can increase bed occupancy and lower costs but must not compromise quality. [1][6]
How BPM Medical Services helps
BPM Medical Services (Delhi-based) specialises in workflow optimisation, data analytics, AI optimisation and custom dashboard development for hospitals. We help implement KPI frameworks, automate data feeds from EHR/HMIS, design visual dashboards with alerts for out-of-range values and run monthly KPI reviews to convert data into action. Combining compliance know-how with operational analytics enables hospitals to meet NABH/NHSRC benchmarks while improving patient outcomes and financial sustainability.
Quick-action checklist for administrators
Standardise KPI definitions using NABH/NHSRC templates. [1][2]
Implement daily bed and ER dashboards.
Automate discharge and readmission flags in EHR.
Run monthly multidisciplinary KPI reviews.
Prioritise infection control and staff retention interventions with measurable targets. [2][3]
Conclusion
Tracking the right data-driven hospital KPIs gives administrators the early warning signals and actionable insight required in India’s dynamic healthcare environment. Use standardised definitions, reliable data pipelines and focused interventions. When KPIs are linked to clear actions and supported by partners like BPM Medical Services, improvements in quality, access and sustainability follow.
Works Cited
Quality Assurance Scores & Key Performance Indicators. National Health Systems Resource Centre, Ministry of Health & Family Welfare, Govt. of India, https://nhsrcindia.org/quality-assurance-scores-and-key-performance-indicators. Accessed 30 June. 2026.
NABH Hospital Accreditation Standard, 6th Edition. National Accreditation Board for Hospitals & Healthcare Providers, Jan. 2025, https://portal.nabh.co/images/Standards/NABH%20Hospital%20Accreditation%20Standard%206th%20Edition%20January%202025.pdf. Accessed 30 June. 2026.
Gnanaraj, J. “Assessment of the Key Performance Indicator Proposed by …” PubMed Central (PMC), 2022, https://pmc.ncbi.nlm.nih.gov/articles/PMC10064356/. Accessed 30 June. 2026.
“About Pradhan Mantri Jan Arogya Yojana (PM-JAY).” National Health Authority (NHA), Government of India, https://www.moneycontrol.com/budget/ayushman-bharat-allocation-almost-unchanged-at-rs-9-500-crore-article-13790757.html. Accessed 30 June. 2026.
“Healthcare Industry in India.” India Brand Equity Foundation (IBEF), https://ibef.org/industry/healthcare-india. Accessed 30 June. 2026.
Best Practices in the Performance of District Hospitals. NITI Aayog, 2021, https://www.niti.gov.in/sites/default/files/2021-09/District_Hospital_Report_for_digital_publication.pdf. Accessed 30 June. 2026.
NABH 6th Edition Standards 2026: 10 Key Changes Every Hospital Must Know. Adrine, Feb. 2026, https://www.adrine.in/blog/nabh-6th-edition-standards-2026-changes. Accessed 30 June 2026.
Private Hospitals Sector in India. Brickwork Ratings, 10 Nov. 2025, https://www.brickworkratings.com/Research/Private%20Hospitals%20report_10Nov2025.pdf. Accessed 30 June 2026.

Comments